For civic society, and the public in general, to have an impact on climate change, they need information more than anything else. Clear, accurate, transparent and concise information will play a key role in organising a wide range of organisations, and at the grassroots level, informing the public on what progress has been made, and what more needs to be done.
Unfortunately, gaining access to this information is not always straightforward, especially for laypersons. The amount of free and open information varies by state or city, and even this information may not be free of bias or even straightforward manipulation. Self-reporting by corporations must be taken with a pinch of salt, while even governmental climate statistics will usually highlight the figures which best support their policy – or present them in the best light.
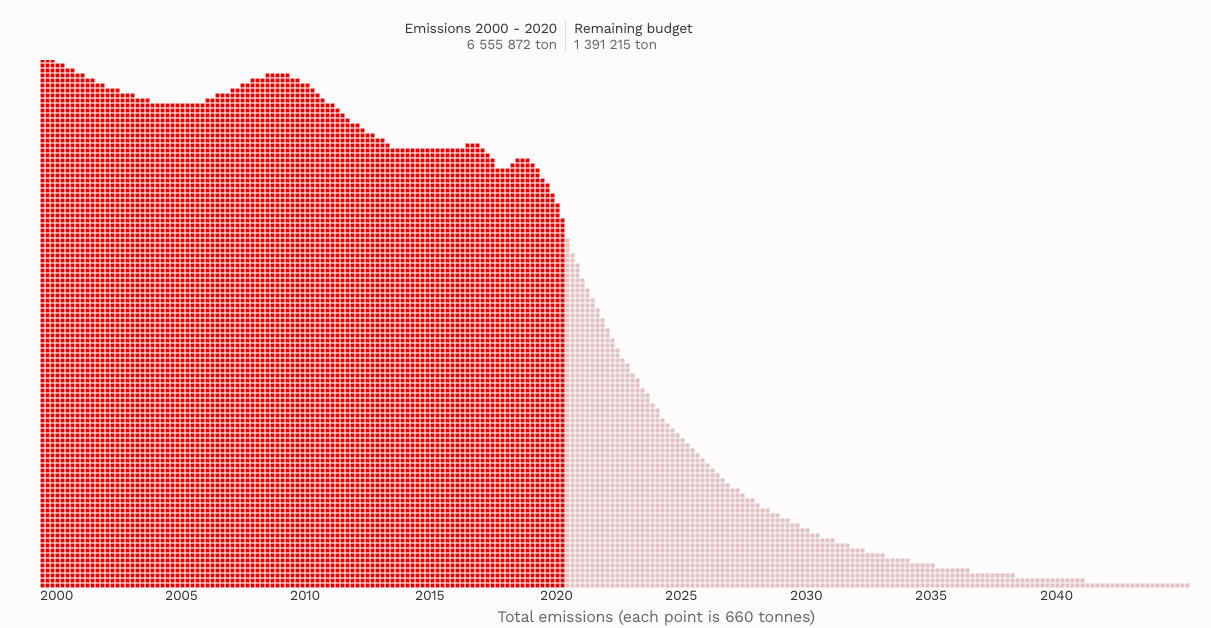
This is where projects such as ClimateVisualizer come in. Developed by the Swedish Klimatsekretariatet, as part of Civic Tech Sweden, and supported by Uppsala University, ClimateVisualizer uses the country’s world-leading climate statistics to better contextualise carbon budgets for local municipalities and the public at large. By packaging and visualising the data into interactive interfaces, anyone can track progress on carbon emissions and reductions – especially those stipulated by the Paris Agreement. This information can play a central role in organising and developing other grassroots solutions.
Anders Heggestad, Director of the Klimatsekretariatet, took some time to answer RESET’s questions regarding how technology such as ClimateVisualuser can be used to boost civic tech:
What was your inspiration for ClimateVisualizer?
For a few years, an increasing number of trustworthy voices has called for municipalities, regions and nations to establish scientifically rooted carbon budgets as a means of quantifying the challenge ahead, and anchor the work within the best known science. We noted that there were no available tools – no frameworks, methods or other supporting functions to help policy makers actually start carbon budgeting. We became the first organisation who addressed that issue in a systematic way. Our work started when a scientific method emerged that addresses how to calculate a local carbon budget. We called up the involved researchers here in Sweden, at Uppsala University, and offered to digitise their information and make it available. We have basically set out to make this emerging concept applicable,and apply it further. In a way, we are involved in creating a new format, which is rather inspiring.
We are also driven by an acute sense that citizens and civil society have the need for, but also right to, unbiased, independent and trustworthy information. There is a quantitative core at the heart of the climate challenge we face: what do we actually emit and how fast must emissions be cut? We believe that this information (current emissions and future necessary emission reductions) is of great importance, and we recognise the complex, and surprisingly wide, gap between science and policy at hand. It’s fair to say that we have partnered with independent scientific frameworks and institutions to make a tangible contribution to bridge the gap. We basically share a growing concern with civic society and citizens around the world, who ask for conscientious information in general and perhaps specifically a trustworthy roadmap to the global temperature targets that comply with the Paris Agreement. In practice such a roadmap is, at its heart, a local carbon budget, and nothing else.
Prior to ClimateVisualizer, how would civil society actors access climate and carbon information?
In Sweden there is quite a lot of publicly available information about greenhouse gas emissions – according to source and geographic origin. If you want to know how much carbon is emitted from a certain sector or subsector within your county or municipality, the data is just a google and a few more clicks away. Similarly, it is relatively easy to access information about national and subnational climate change targets and strategies. In connection to the targets it is also common to get an updated prognosis of how close or far off we are with respect to reaching a specific target. Most countries lack this periodically published data on a city or municipality level though. And neither in Sweden nor in other countries is it possible to get information that helps us evaluate to what extent we are contributing our fair share to limiting global warming. Now, that should be the precedent question to answer, we think.
We often hear opinions expressed such as “we do more than others”, or “we don’t do enough”, but the question we would like to answer through ClimateVisualizer is “what does doing enough” mean, in a certain country, region, municipality, or city? Of course, the answer you get through the model presently available in ClimateVisualizer is one among many possible answers. But there are crucial features present in our tool: we present emissions cumulative, we integrate a carbon budget that has been calculated according to best practice and we make sure that it is updated regularly. We also delimit the scope and package this data for a certain city or municipality, thereby making the relevant data available to those whom it concerns. And we let leading scientists validate our work.
How is the climate data repackaged into an open source resource? What are the most important elements?
We are open source at heart, and have chosen to be registered as a nonprofit, but we have not yet utilised the possibilities of altruistic and joint collaboration much. We often provide NGOs and other nonprofits, or journalists, with information or data, but really want to tap into the distributed power of going open source. We started in a location where sharp deliveries immediately kidnapped our time, and in order to open up our code base we need more time. We hope this will change soon. Give us a call if you think you can help!
What are the future plans for the development of ClimateVisualizer?
At the moment our primary focus is to do whatever is necessary to scale the platform as widely as possible, which among other things means integrating varying data sources, translating content and managing edge cases that we encounter along the way. In parallel, we’ll of course try to improve the user experience in general and especially make sure that everything is as self-explanatory as possible for the first time visitor who’ve never heard of the concept of a “carbon budget”, and at the same time support more in-depth exploration by politicians, journalists, teachers and others who are curious to learn more.
Civic Tech Sweden has many different and diverse projects. In what other areas do you see civic technology making the biggest impact?
If we start by looking at the broader climate field we see amazing possibilities. The main purpose of climate statistics is to establish a feedback loop between actors and the scope of reality they aim to change. If that loop is regularly updated, cleverly visualised and made publicly available it can drive change on many levels. Governments will not do this for us in an independent and scientific manner. So this is a huge challenge for the open source community and civil society.
From another perspective civil society is forming ever stronger alliances right now, where they demand action and responsibility. That is words. They need to be backed up by figures. But governments gather, aggregate, visualise and distribute data in a fashion that suits policy needs, not public needs. For instance, we are used to looking at climate statistics as annually separated staples in a diagram. But there is no annual separation of the ever increasing – accumulating – volume of carbon dioxide that is stored up in our atmosphere. It’s one volume. And that very volume is what is determining and driving global heating. So let’s start looking at volumes – let’s gather and visualise climate data cumulatively!
Outside of the climate field we have little expertise. One field of great importance is to counter proprietary big tech solutions, thereby strengthening democracy and transparency; we need to take back control over a reality that has become digital very fast, and where we need “forests”, “open spaces” and human rights, just like in the physical dimension of reality. But this is old news we suppose.Thank you for your time Anders!
The article is part of our Special Feature “Civic Tech – Ways Out of the Climate Crisis with Digital Civic Engagement”. You can find all articles of the Special Feature here: Special Feature Civic Tech

The Special Feature is part of the project funding of the German Federal Environmental Foundation (Deutsche Bundesstiftung Umwelt – DBU), in the framework of which we are producing four special features over two years on the topic of “Opportunities and potentials of digitalisation for sustainable development”.
More information here.

