The EcoVision Lab has ambitious goals: to improve quality of life for people around the world while better protecting the environment at the same time. The research group affiliated with ETH Zurich and led by Dr Jan Dirk Wegner explores environmental and social issues from the perspective of computer science. Developing approaches mainly in the fields of (deep) machine learning, computer vision and remote sensing, EcoVision Lab works at the interface of computer science, ecology, and engineering.
One exciting project from EcoVision Lab is the development of a tool that will be able to map the world’s biomass. They hope it will become an established standard when it comes to assessing forested areas, when, for example, there are plans to clear them in order to farm the land. The tool is designed to give answers to questions like: Is this area of forest particularly worthy of protection in terms of its biodiversity? Is it a crucial carbon store or does the indigenous population maybe have rights to of land? Or is it an area classified as “less worthy” of protection from a socio-ecological perspective and it can in fact be cleared?
We talked to Jan Dirk Wegner and Nico Lang from the EcoVision Lab about how the tool is able to provide a transparent and objective basis for this kind of decision-making, what the role of satellite data is, and what exactly the “High Carbon Stock Approach” is all about.
Jan, you founded the EcoVision Lab at ETH Zurich almost four years ago. What are you doing there?
Jan: The personal motivation behind it was the desire to do something meaningful for the good of society and the environment. We have a lot of colleagues who are active in that area, of course. There are many good researchers, but they often don’t have as much technical know-how, especially when it comes to the field of machine learning. The idea was for us to contribute exactly that. That’s why we’re always looking for partners from related disciplines, identifying what the scientific problems are, and then creating innovations using machine learning, on a very technical level. That’s our approach, and we don’t really know of any other groups that work in that way.
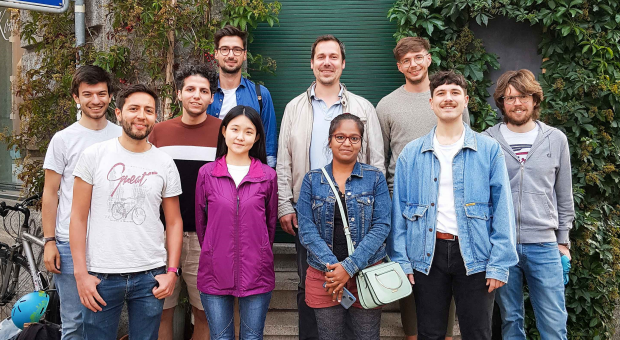 © EcoVision Lab/ETHZ The EcoVision Lab team at ETH Zurich (June 2020).
Jan Dirk Wegner, a native of Oldenburg, studied geodesy and geoinformatics at Leibniz Universität Hannover, where he also wrote his doctoral thesis. In 2012, he initially joined ETH Zurich in a postdoc position, worked in the field of computer vision and founded the EcoVision Lab in 2017. Nico Lang completed his Master’s degree in Geomatics at ETHZ, moved into machine learning via Jan and is currently doing his PhD in the EcoVision Lab research group.
In your work in the EcoVision Lab, you rely primarily on remote sensing, is that right?
Jan: Yes. Since our team is part of a remote sensing group and we have a lot of experience in that field and also a lot of software to process satellite images immediately, we often work with remote sensing data. But we can basically process any kind of data. We also use social media imagery, for example, and increasingly climate and weather data. We can also use text-based data, for example, to evaluate questionnaires using a machine. We did that, for example, in a small project to estimate the amount of child labour there was in the cocoa industry.
One of your current projects is the development of a High Carbon Stock Mapping Tool, a global biomass mapping tool. This tool is to be based on the “High Carbon Stock Approach”. Can you explain to me what is behind that approach?
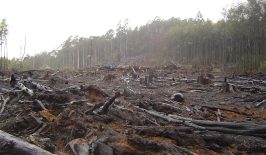
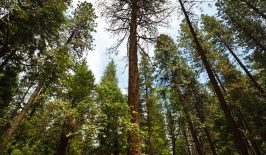
Nico: The High Carbon Stock Approach is a method developed by various NGOs such as Greenpeace and WWF in collaboration with large companies, such as plantation owners and companies that process raw materials from plantations. The HCS Approach is intended to become a tool for land-use planning. It distinguishes between forest areas that are particularly worthy of protection, for example, those with high biomass and high biodiversity, and land areas that are less worthy of protection, where, for example, economic development projects could potentially take place.
What are the criteria for that? What makes an area of land “less worthy of protection”?
Nico: The HCS approach has defined a set of rules for distinguishing between forests that are worth protecting and those that are not. There are several indicators that come into play, one being biomass, but also biodiversity. One main factor is how much carbon is stored in such a forest. And the HCS approach also takes into account the rights of the local population. So not all indicators are directly measurable. You also have to gather specific information about how the land is actually being used.
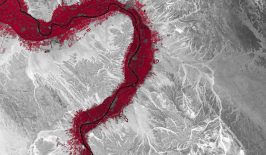
 © highcarbonstock.org The HCS threshold distinguishes areas that should be protected from those that can potentially be repurposed.
So there are already maps available that represent forests’ carbon stock. What does your project hope to offer in addition?
Jan: If a company wants to expand a plantation, there are already legal requirements in the countries where those crops are being grown, but they are often very opaque. You have to deal a lot with local authorities, with various administrative units, and at the same time with consulting firms that, for example, create these carbon stock maps. Because the consulting firms are commissioned by the companies who own the plantations, the result – not surprisingly – is that the carbon stock is often underestimated. In other words, plantations are expanded too much, even though there is supposedly an objective approach.
I feel like right now there’s no method available that allows us to carry out objective monitoring of the conditions on the ground, in a replicable and transparent way – one which applies to everyone in the same way and which all companies adhere to.
So you want to develop a transparent and objective basis for decision-making. But the question would be, why should the food producers adhere to it…?
Jan: Certainly one reason would be that there is more and more pressure on the companies from the public. And there is also pressure from journalists, scientists and politicians. That certainly helps to drive forward that kind of development. The sustainability departments of large companies are becoming increasingly important.
Which technologies and data are you using in order to create the objectivity that you aim for?
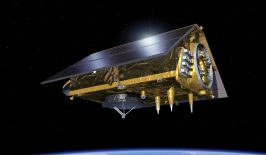
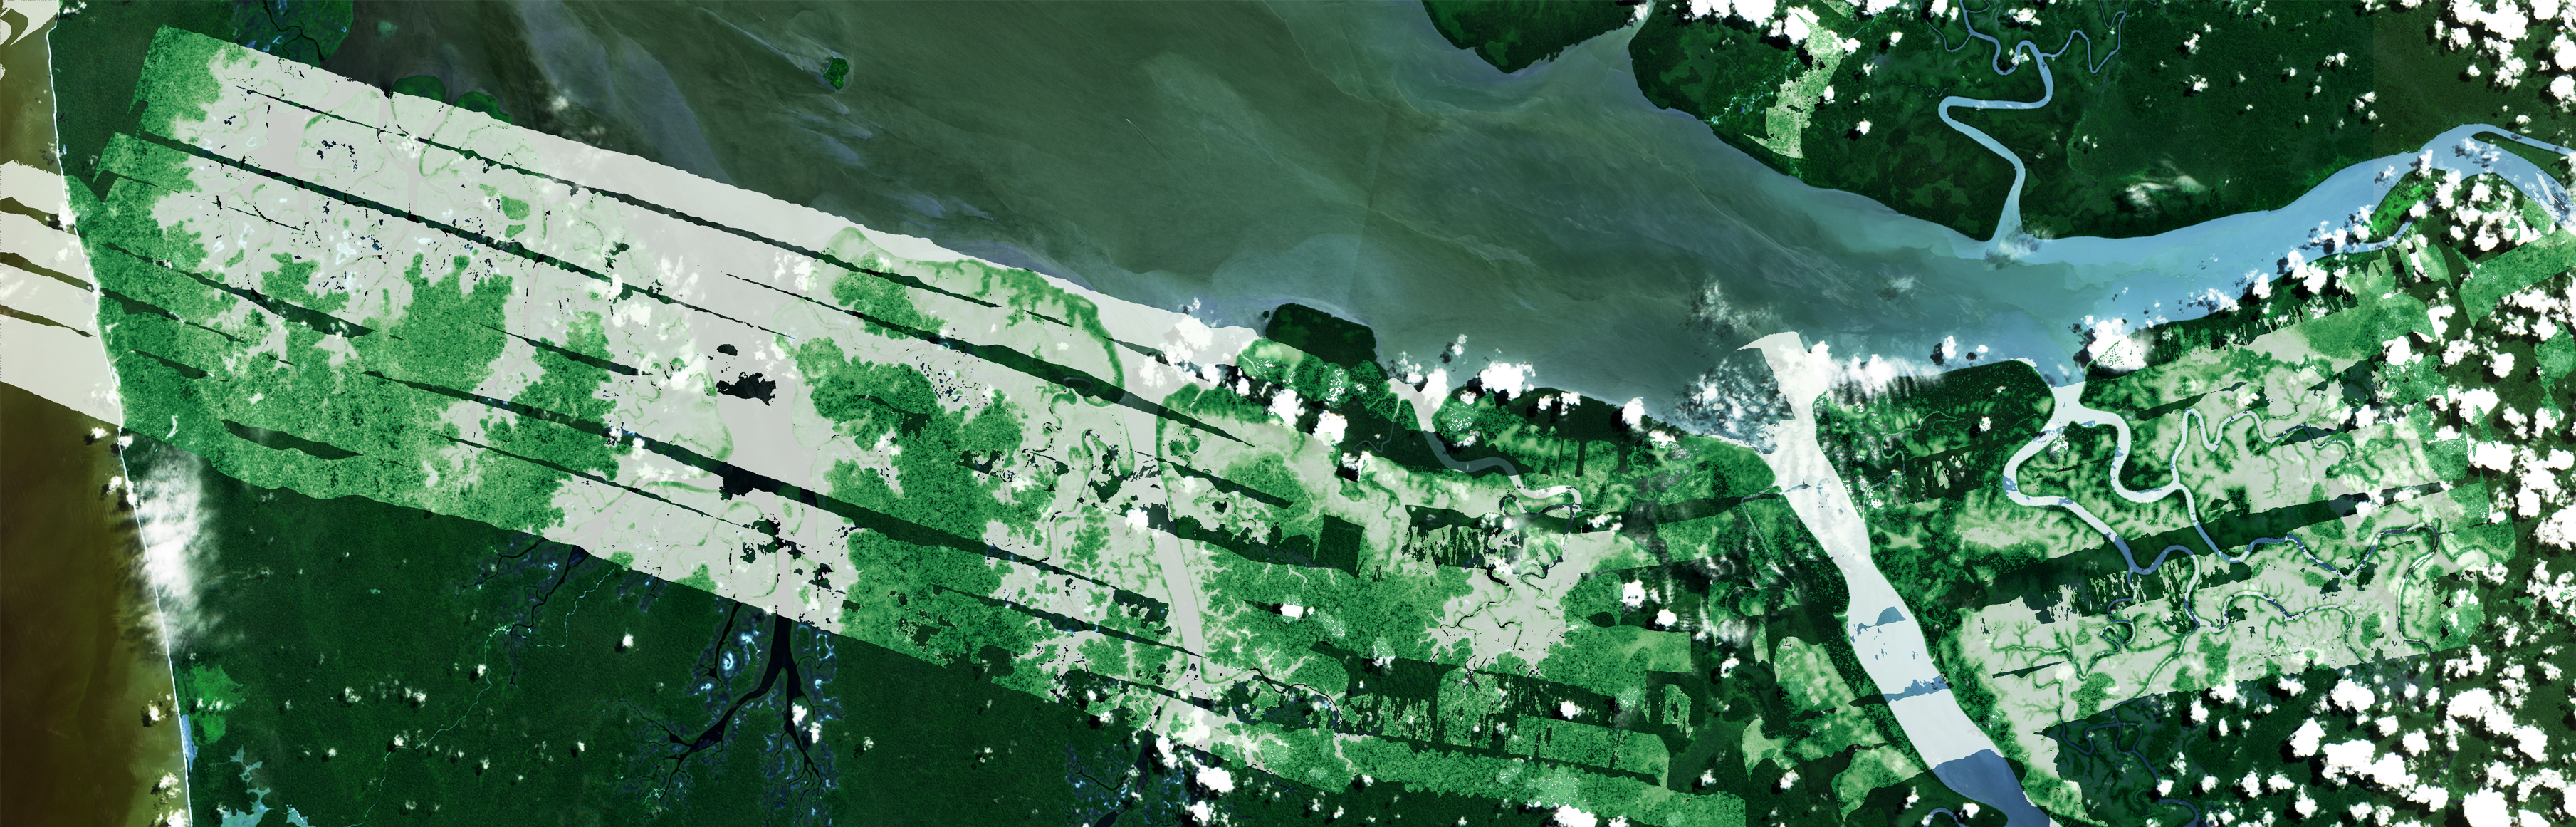
Nico: We use freely available satellite images from ESA, from Sentinel-2. However, it is very difficult for humans to interpret these satellite images – with machine learning it’s much better. Our approach ultimately combines different data sets. We train our model with reference data, for example vegetation height or biomass data, so that it can detect or measure exactly those indicators when looking at the satellite image. It’s a process that would be impossible for the human eye.
Why are you using satellite imagery for this? Are there alternatives you could use?
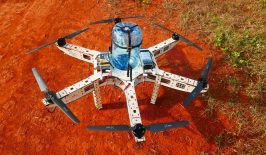
Nico: One of the main advantages of the satellites in this mission is that they take photos every five days at the same location. So we get a relatively up-to-date picture of the situation. And, of course, they offer us images of the entire planet. That’s the biggest advantage over other methods, such as drones for example. But there are also other measurement methods, such as SAR (Editor: synthetic-aperture radar), which is radar data. Our goal is to use that data as input as well. The advantage of that would be that that data is independent of cloud cover. Especially in tropical areas, it’s important that data isn’t disrupted by clouds.
Jan: Currently, maps of carbon stocks are created using airborne data, such as laser scanners that take measurements from aeroplanes. The problem is that those missions are very expensive because you have to launch an airborne mission from Jakarta, for example. You have to get the aircraft there first, set everything up, then you have to hope for good weather, and only then do you go. That means it’s also difficult to replicate multiple times. So the satellite imagery that we use has a huge advantage over that. On top of that, we want to use data that everyone can access, every single person. We’re planning to publish our tool’s source code too. As well as offering transparency, that also means that any errors can be uncovered by other people. We hope that will lead to greater acceptance – and ultimately to better quality and also objectivity by as many users as possible.
What exactly do you do with the satellite data?
Nico: The first step is to atmospherically correct the satellite images. There is a lot of interference between the Earth’s surface and the image sensor, so we first have to factor that out. We just use ESA’s standard tools for that. Then, when we have a clearer picture, we combine the georeferenced satellite image with other georeferenced data that we get, for example, from airborne laser scanning measurement campaigns. For example, we can derive vegetation height from 3D data and combine it with the satellite imagery – and that is ultimately the training dataset for the algorithm.
Then our Convolutional Neural Network, an artificial neural network, looks for texture, for patterns that help estimate, for example, vegetation height from the image. These Sentinel-2 images are so-called multispectral images, so they have RGB channels like a normal cell phone camera, but they also have other channels in the infrared range that can help find patterns too. So the strength of such a Convolutional Neural Network comes from the fact that it can recognise and learn texture features.
As far as I understand it, your underlying image data has a resolution of ten by ten metres. What can be derived from that and what are the limitations?
Nico: We’re limited in terms of being able to identify individual trees. But the tool does allow us to make relatively regional decisions on different areas of forest.
Jan: You also asked about the limitations. That’s where it’s important to emphasise that we’re creating what’s called an indicative HCS map. What’s missing in it are indications that we can’t see from space, from the satellite. These are, for example, specific indicators of biodiversity. After all, areas with very high levels of biodiversity should also be protected. But we’re not able to recognise that in every case. And if, for example, there are communities living there, or indigenous people who have ancestral rights to this land, we can’t recognise that from the satellite either. But that’s exactly the kind of information that’s going to be incorporated too. That is, our map that we are providing now is not “finished”. It just objectively measures biomass and what that biomass is. But we then add additional information that’s provided by local people, Greenpeace and other NGOs. What’s most important here are the existing rights of local communities, local people and indigenous people.
How do you get the data that you use as a basis for your tool and how do you process the data? There must be so much of it!
Nico: That’s right. We download terabytes of image data. We’re lucky to have a large cluster, i.e. a data centre, where we process it. Using a local machine, it becomes difficult to analyse larger areas.
Jan: That’s a very important point that you raise, because that’s exactly the “bottle neck” of a method like this. The problem isn’t being able to process so much data – for that, all you have to do is buy or provide the computing power. The real problem is downloading the data and doing so as quickly as possible – and new data is being collected all the time. Now we do this on the ETH supercomputer, but when we bring it into the application later on, we’ll actually need a cloud where a much larger bandwidth is available to automatically download these satellite images from ESA or wherever they are always already available. We’ll probably need a special agreement with ESA to make that happen.
What else could this global mapping tool be used for?
Jan: In general, there are currently no tools available that measure biomass with the accuracy we are aiming for. The best map we know has a 100-metre resolution – we want a 10-metre resolution. So we’re dramatically improving the global biomass map in its spatial resolution and in its accuracy. And we’re designing it so that we can update it almost continuously in near real-time, which is impossible right now. This is of course essential for many applications. Land-use planning, for example: if the Indonesian government is planning new areas for urban settlements or industrial zones, then areas with high biomass, which we consider worthy of protection, should be taken into account in the planning. Any new settlements should only built in areas where as little nature as possible will be destroyed.
Climate research is also a potential application, because a high biomass of course also represents large carbon reservoirs and high amounts of oxygen production. And a highly accurate biomass map is also very important for biodiversity modeling, because high biodiversity often correlates with high biomass. Where there are dense virgin forests, there is also a large diversity of different species.
When the tool is ready, what’s next? Where is it going to be used?
Jan: I think a lot of companies have a lot of interest in this. Our idea is to have a licensed tool with a web interface that creates HCS maps for companies or gives access to provides access to them – at cost price. In the HCS process, there is always an independent panel of scientists, of experts, who check to see whether a company’s plans to extend agricultural plantations are okay or not – based on that map, taking into account the prior rights of indigenous people. We envision that as a model through which maintenance, personnel, and also the cloud infrastructure for the tool could be funded. We could also approach the United Nations. It’s not entirely clear right now. In any case, it is a non-profit system. We don’t plan to making money with it.
We hope that our tool will become a standard – perhaps comparable to the RSPO, the Roundtable on Sustainable Palm Oil. By establishing certain standards that everyone has to adhere to, everyone has the same insights, equal opportunities and disadvantages. Even if there are disagreements, everybody can refer to the same results, the same tool. That is my hope and right now, I’m optimistic!
This article is part of the RESET Special Feature “Satellites for Sustainable Development”. Click here to explore all of the articles in the series.
This is a translation of an original article that first appeared on RESET’s German-language site.